
AI Reports and Analytics
Your numbers explained, not just displayed
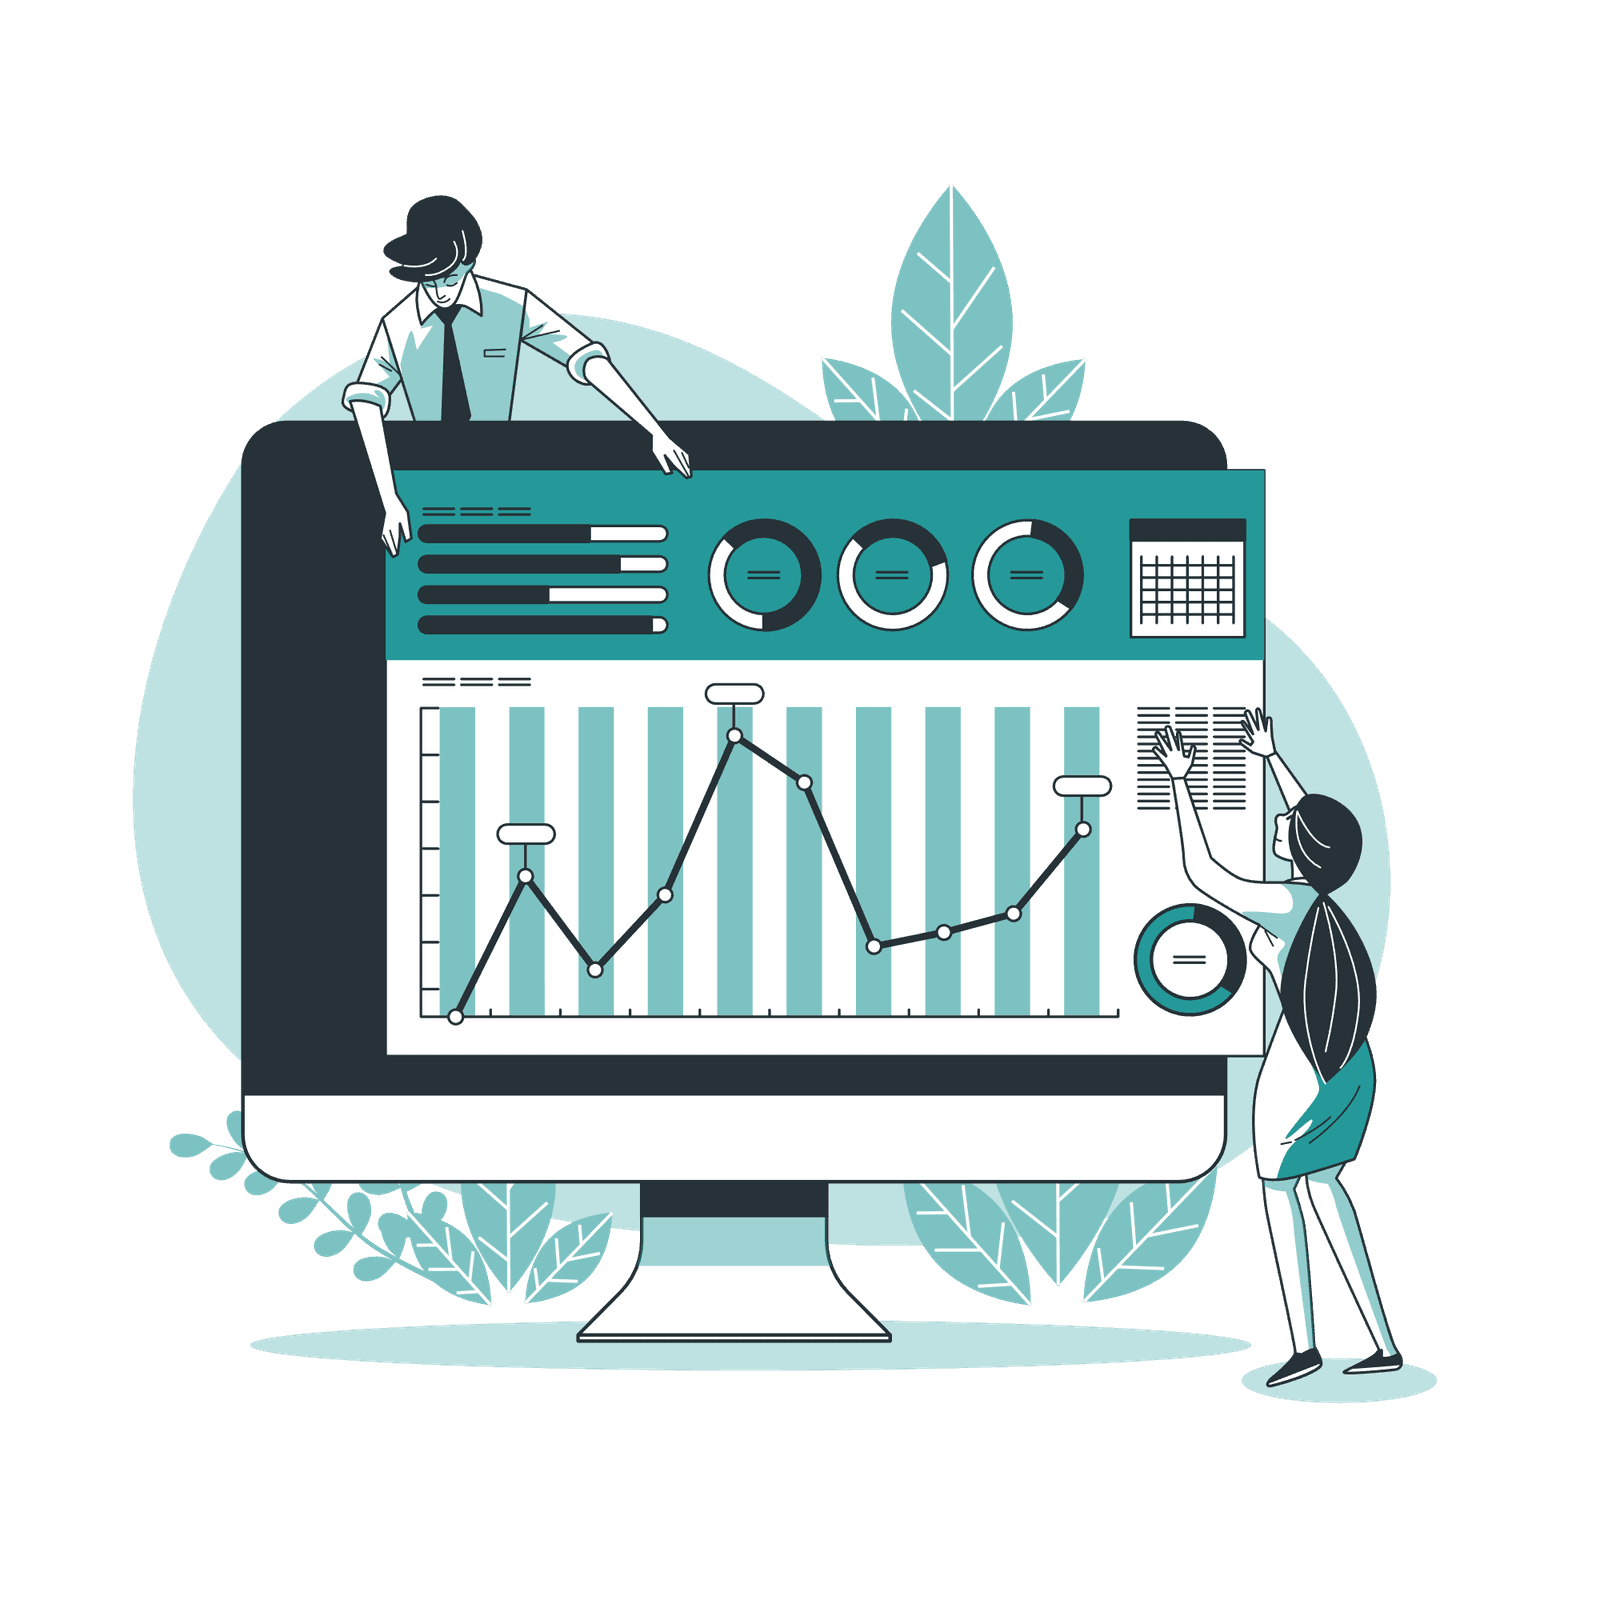
Comandator turns every ticket, dish and work hour into reports you can read in a minute. The AI tells you what's happening in your business, not just shows you a table.
Included with POS and higher plans. Nothing to configure.
Benefits
Why it actually helps you decide
A summary in plain language
Instead of a lone chart, the AI writes what changed this week versus last week and why, with the numbers behind it.
See which dishes actually pay the bills
A product ranking by units sold and by margin, so you can spot at a glance which dishes to push and which are dead weight.
Your real busy hours and days
Sales broken down by time slot and day of the week, so you can plan shifts and orders around real demand, not guesswork.
Comparisons without doing the maths
Automatic comparison against last week, last month or last year. See if you're doing better or worse without a calculator.
One dashboard, not five screens
Sales, average ticket, products and staff in one place. No more jumping between the POS, a spreadsheet and your memory.
How it works
How you use it day to day
- 1
It builds itself from every sale
Nothing to export or prepare: every ticket from the POS or online orders feeds the report in real time.
- 2
Open the dashboard whenever you need it
When closing the till, before ordering from suppliers or at the end of the week, open it and read the summary already written for you.
- 3
Filter by location, date or category
Running several venues or only want to see drinks or the weekend? Adjust the filter and the report recalculates instantly.
- 4
Act on what you see
Raise a price, drop a dish that never moves, or add staff to your busiest slot, backed by data instead of a gut feeling.
In detail
What the analytics module includes
FAQ
Frequently asked questions about reports and analytics
Is the data updated in real time?
Yes. Every sale from the POS or online orders feeds the report as it happens, no waiting for a closing or exporting anything.
Can I compare several venues if I run more than one?
Yes, if you manage several locations you can see a combined summary or filter by venue to compare how each one performs.
Does it help me decide on prices or drop a dish?
That's exactly what it's for: seeing which dishes sell a lot but leave little margin, and which barely get ordered, so you can adjust the menu with data.
Related features
Everything connects: these features work alongside this one.
Start seeing your numbers clearly
Create your account and switch on the POS to get your reports from the very first ticket.